Category Archives: Math

Farmers’ Market Day

farmersmarketdayI am counting the days until my local farmers’ market opens. Until then, I’m glad I found this perfect pick: Farmers’ Market Day written by debut picture-book author Shanda Trent and illustrated by Jane Dippold. This rhyming book is a quick read that can easily be turned into an interactive “imagination” station or a fun math center for students to practice counting money.

A little girl and her family go to the farmers’ market on Saturday. The little girl has her own money from her piggy bank and she’s not sure what to buy – maybe a basket of cherries, a jar of honey, freshly-baked bread or flowers for the garden? Each enticing item is labeled with a price tag, like $2.00, or 12/$3.00, or 50 cents. Reading aloud this short rhyming book will have your little listeners eager to choose what they’d buy for themselves, and that’s where you can extend the book in ways to draw your students back to rereading.

Younger students can make their own farmers’ market in a pretend-play area. Plastic fruits, vegetables, and flowers can be bought and sold. Students can use Farmers’ Market Day to decide what should be for sale and how much to write on each price tag. (Using the information found in both the text and the pictures is a way of Integrating Knowledge and Ideas. Woohoo!) Older students can use the book to practice money skills. Ears of corn cost $3.00 per dozen – how many ears of corn do you need to feed your class, and how much will it cost? If you have $10.00, what items would you buy? Show your shopping list! With summer and real live farmers’ markets just around the corner, Farmers’ Market Day is a real treat.

Doggone Feet is Doggone Fun!

There are many perks to being a children’s librarian (no overdue fines has saved me a bundle over the years) but one of the best parts of my job is getting to know supah-cool authors and illustrators like Leslie Helakoski. Leslie is a Michigan treasure I’ve had the pleasure of knowing for years, and I’m geeked to share her brand new book with you: Doggone Feet.

Dog follows a pair of feet home from the park one day and finds her perfect place under the table. Life is good until two more feet come on the scene:
“They’re twirling leg twisters, toe-tapping kiss-kissers,
rule-listing insisters of doggy shampoos.”
So now the space under the table includes the dog and two sets of two feet, until another pair come along – tiny baby feet. As the family grows the dog must accommodate more pairs of feet in her shrinking space, and she’s not sure she likes the new additions. In the end, though the space under the table is crowded and cramped, the message is clear: families always make room for more.

The first time I read this book, I immediately thought how it perfect it would be for a math lesson. If there were two dogs and three humans, how many feet would be under the table? It’s also a great book to talk about point of view – both figuratively and literally. The story is told from the dog’s perspective, and we don’t see the faces of the humans, just their feet, until the end of the book. You can talk with your students about author/illustrator’s Craft and Structure – why did Ms. Helakoski choose to frame all the illustrations from this different point of view? How might a mouse see life under a dinner table, or a fly over a school cafeteria table at lunchtime? It’d be fun to have students spend a writing session on the floor under their desks, to inspire them to write and draw from a different point of view.

Then I saw the terrific trailer that Leslie’s son, Connor, made for her book:

How cool would it be to combine book-trailer technology with a math lesson centered around Doggone Feet?! Using a free app like Educreations on the iPad or a program like iMovie on computers, students could make a mini-movie to retell the events of the story (check off Key Ideas and Details on your Common Core State Standards score card) either by drawing the action or physically acting it out, adding up the feet as you go. With all the wonderful rhyme and wordplay, it’d be great for Reader’s Theater!  Doggone Feet will be so doggone much fun for your students!

For more information, please visit Leslie’s website at helakoskibooks.com.

What To Do With All That Halloween Candy: Try The Great Graph Contest!

When I was a kid, my brother and I would empty out our bags after trick-or-treating on Halloween and divide the candy into piles: lollipops, bubble gum, candy we were willing to trade, favorites that would be hoarded, etc.  I kept careful count of how many of each of my favorites I had, to make sure I’d know if one went missing (my brother was sneaky.) If I’d only had access to The Great Graph Contest by Loren Leedy when I was little, I could’ve made the best kind of bar graph – a candy bar graph – and organized all my trick-or-treat information with real-life math practice.

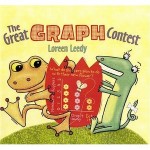
In The Great Graph Contest by Loren Leedy, a toad and a lizard compete to see who can make the best graphs. Leedy introduces bar graphs, picture graphs, pie charts, and Venn diagrams simply and with a sense of humor. Your class can use the information on making graphs to practice math with a subject they will find inherently interesting – their candy.

So, share the book with your students (noting with pride how easily you are working the Common Core State Standard of Range of Reading into your curriculum.)  Next, get your hands on some candy. You can have students bring in some from home, you can steal from your own kids’ Halloween stash, you can get an assorted bag from the store – if lots of candy in the classroom doesn’t sound like a sweet deal to you, have students just bring in wrappers.

Talk about the different kinds of graphs found in the book, and which would be best suited to organize information about your candy. Sort candies by color of wrapper, ingredients, by beginning letter, etc. Paste wrappers to make a picture graph, or create bar graphs if you have large amounts. Make Venn Diagrams for things like “candies with chocolate”, “candies with nuts” and which candies would be the union. Graphing candy makes for a sweet math activity!

For more information, visit Loren Leedy’s website at: lorenleedy.com.

Bones: Skeletons and How They Work

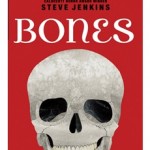
I could say, “here’s an informational book that will tickle your funny bone” or  “it’s so good it’s scary”, but Bones: Skeletons and How They Work by Steve Jenkins needs no rib-tickling tricks to get kids’ attention. For Halloween or health units, this book is thoroughly engaging.  Using cut paper, Jenkins makes incredible illustrations of all kinds of bones to show how structure aids function. Some of the bones are shown actual size, so it’s easy to compare a human skull to that of a baboon, a dog, a parrot, or an armadillo. Some bones are too large to show in actual size, so Jenkins makes the bones to scale. Kids can compare an adult human’s foot bones to the fossil foot bones of a Tyrannosaurus rex!  Not only is this book visually a treat, it’s chock-full of “who knew?” facts that kids love: “a giraffe’s neck is as long as a man is tall, but giraffes and humans have the same number of neck bones: seven.”

I love sharing informational books like this with students. With Steve Jenkins’ books, I’m squeezing in the Common Core State Standards of Range of Reading and Key Ideas and Details, I can work interesting books into math and science units, I’m immersing my students in nonfiction, and all the while the kids think they’re just enjoying a good book. Because  most of Jenkins’ illustrations are actual size or to scale, you can use Bones: Skeletons and How They Work in a measurement lesson. Kids can estimate how long a bone is and measure it with a ruler. For higher level math, have students measure the to-scale illustrations and multiply to get actual-size measurements.

If you read this book with students around Halloween, it can be a springboard to make some spooky decorations. At enchantedlearning.com, you can print off a human skeleton template for students to cut out and put together with brads to see how all our bones fit. Hang up the skeletons and your decorations are not only scary, they are scientific! For a treat that’s not loaded with sugar, try serving “Bones Dipped in Blood” (pull breadstick dough into bone shapes, bake, and serve with pizza sauce.) To incorporate a bit of technology and to rock it old school, go to YouTube and treat your students to the Schoolhouse Rock video clip of “Them Not-So-Dry Bones”. “Right now there’s a skeleton locked up inside of you!”

For more information, please visit Steve Jenkins’ website: stevejenkinsbooks.com.

Just a Second: a different way to look at time

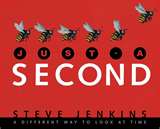
How many times do you think a hummingbird beats its wings in just one second? 10? 20? Steve Jenkins makes math irresistible  in Just a Second: a different way to look at time. In one second, a hummingbird beats its wings 50 times. In one minute, a grizzly bear can charge one half-mile.  Just a Second is full of information that fits well into units on time, measurement, and estimation, plus it’s visually captivating with Jenkins’ signature cut-paper art. His process in making the collages for his book is really cool, and you can see a video of how his books come together on his website: stevejenkinsbooks.com.

Before reading Just a Second, make some predictions with your students, like how many breaths do you think an adult takes in one hour? (900!) After reading the book and checking your predictions, make and test some new predictions about time. How many jumping jacks can you do in one minute? How long will it take you to flap your arms 50 times like a hummingbird? Can you sit perfectly still and quiet for a full minute? You can compare students’ results on charts or a graph. You can even make a pictograph of your classroom results, and let students make cool representations for themselves with cut-paper art. It may take a bit longer than “just a second”, but it will be time well spent.